NBA Point Spread Strategy: How to Beat the Spread and Profit
Most UK punters who start betting on the NBA go straight for the moneyline. It feels natural — you pick who wins, you collect if you’re right. I spent my first season doing exactly that, wondering why my edge kept evaporating despite a solid read on the games. The answer was the spread. The NBA point spread is not just a different market; it is a fundamentally different way of thinking about basketball. Once you understand it properly, the moneyline starts to feel like playing chess with half your pieces missing.
The spread is where the serious money moves in NBA betting. It accounts for the overwhelming majority of handle on any given game, which means it concentrates the sharpest attention from both bookmakers and professional bettors. That makes it harder than the moneyline — but also more exploitable for those who do the work. This guide covers the mechanics, the signals, and the data-driven frameworks I use to identify value against the spread on UK bookmakers.
What you will find here is not a beginner’s glossary. If you need the very basics of how basketball betting odds work in the UK — decimal conversions, implied probability, what each market represents — there are foundational guides covering that groundwork. This article assumes you already understand what a spread is in principle and want to know how to approach it with the analytical rigour that actually produces returns over a season.
How the NBA Point Spread Works
The simplest way I can put it: the spread eliminates the obvious. When a top team hosts a bottom-five side, betting on the favourite to win is not a decision — it is a formality. The spread forces you to answer a harder question: will they win by enough?
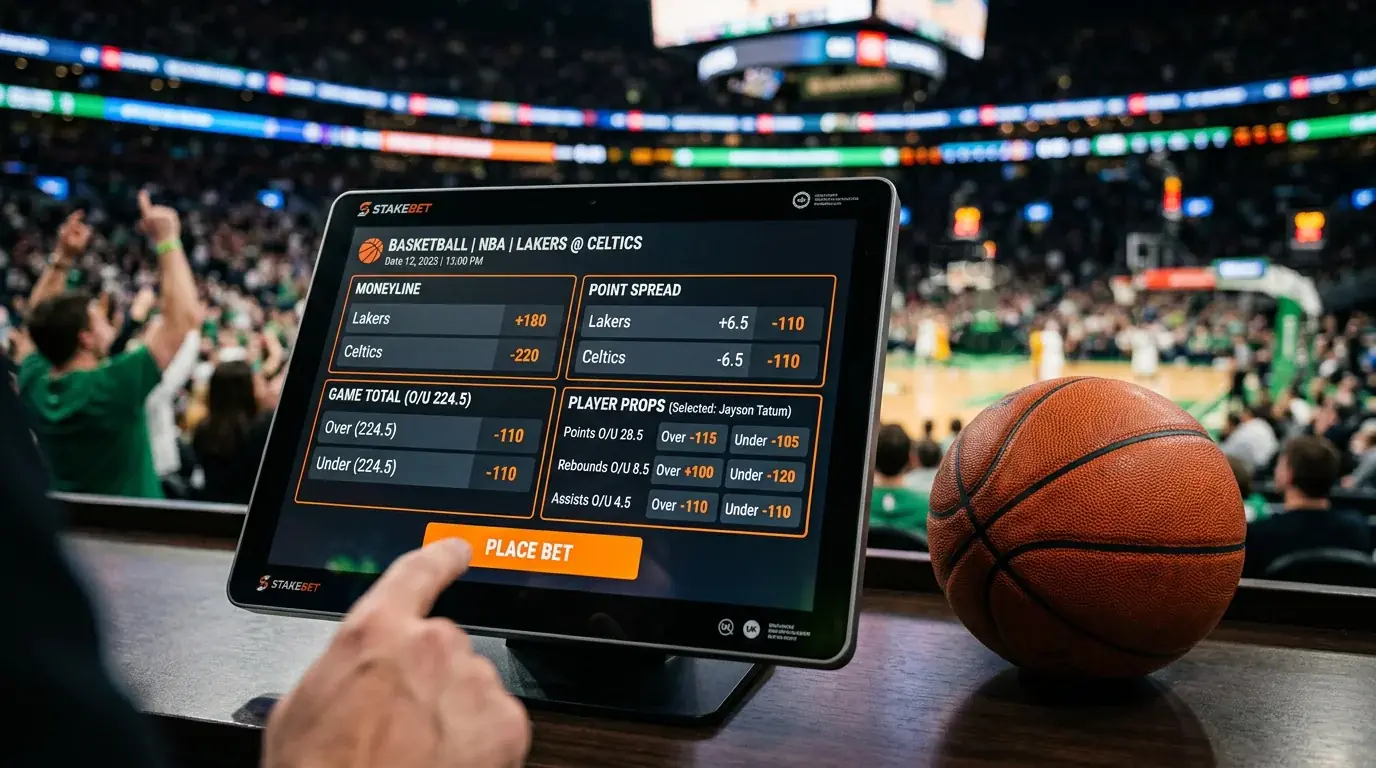
Here is how it works in practice. A bookmaker sets a line — say, Lakers -7.5. That number means the Lakers need to win by 8 or more points for a bet on them to pay out. Conversely, if you back the opposing team at +7.5, they can lose by up to 7 and you still win the bet. The half-point matters because it eliminates the possibility of a push — there is no such thing as a 7.5-point NBA result, so every bet settles as a winner or a loser.
On UK bookmakers, NBA spreads are typically displayed in decimal odds format. A standard spread will show something like Lakers -7.5 at 1.90 and the opposing team +7.5 also at 1.90. That pricing on both sides represents roughly a 52.6% implied probability on each side, with the gap between the two representing the bookmaker’s margin — also called the vig or juice. To break even betting spreads at 1.90, you need to win 52.6% of your wagers. That is the bar you are clearing.
The spread is set by bookmakers not to predict the correct margin of victory, but to attract balanced action on both sides. That distinction is important. The opening line is an educated opinion; the closing line is a consensus refined by every pound wagered between open and close. These two numbers are often different, and that gap is where information lives.
One term that comes up constantly in NBA spread betting is ATS — Against The Spread. A team’s ATS record tells you how often they have covered the spread rather than simply won or lost the game. A team can have a 40-win season and a losing ATS record if they kept winning games by smaller margins than expected. This is the core metric for evaluating spread performance, and it is the lens through which I analyse every team situation.
Reading Line Movement: What the Numbers Tell You
I remember watching a line swing two full points inside six hours before tip-off, while public betting percentages showed 70% of tickets on the team the line was moving away from. That combination — line moving against the public — is exactly what sharp movement looks like. It is one of the most reliable signals in NBA betting, and most casual punters miss it entirely.
Every spread has a lifecycle. The opening line is posted — usually the night before or early on game day — based on the bookmaker’s power ratings and situational factors. From that point until tip-off, the line moves in response to two forces: volume and information. Understanding which force is driving any particular move is the skill that separates disciplined bettors from guesswork.
Volume-driven movement happens when a disproportionate amount of money lands on one side and the bookmaker adjusts to rebalance exposure. If 80% of the money comes in on Team A, the bookmaker shades the line toward them to attract action on the other side. This kind of move is public money at work — and it is often the wrong signal to follow. Public bettors overwhelmingly back favourites, home teams, and recent winners. Bookmakers know this and price accordingly.
Information-driven movement is something else entirely. This is what the industry calls sharp action — bets placed by professional syndicates or highly accurate models that bookmakers have learned to respect. When a sharp bettor places a significant wager, the bookmaker often moves the line immediately, sometimes before any meaningful volume has come in. The tell is a line that moves against the public ticket percentage. If 65% of bets are on Team A but the line drifts toward Team B, that is reverse line movement — the clearest sign that professional money disagrees with the crowd.
For UK bettors, tracking line movement has become more accessible. Opening lines and closing lines are published by several data services, and comparing the two tells a story. A closing line that has moved 1.5 to 2 points from the opener in favour of one team signals genuine conviction from the professional betting market. When my read on a game aligns with the direction of sharp movement, my confidence in the position increases significantly.
The closing line itself has predictive value independent of any individual opinion. Research consistently shows that the closing spread is the most accurate predictor of game outcomes — more accurate than any single model, because it aggregates all available information up to tip-off. One practical application: if you can consistently bet at prices better than the closing line, you will show a profit long-term regardless of short-term variance. This concept — closing line value, or CLV — is the benchmark I use to evaluate my own betting performance over any given stretch of games.
ATS Records and How to Use Them
ATS records are the most frequently cited — and most frequently misused — data point in NBA spread betting. A team’s season ATS record tells you how often they covered the spread, but it does not tell you whether that record reflects genuine market inefficiency or simply variance. Understanding the difference is essential to using the data correctly.
The teams that produce the most reliable long-term ATS records are those the market chronically underestimates. OKC Thunder’s 69-39 ATS record — a cover rate of 64% over two and a half seasons — is the standout example in recent data. As VSiN’s Steve Makinen noted when reporting this figure, «OKC’s 69-39 ATS record during the 2-1/2 years of this study is the league’s best among teams.» Orlando Magic’s 65-42 record (61% cover rate) follows the same pattern: teams whose quality exceeded public and market perception consistently enough to produce a multi-season edge.
Both teams have one thing in common: they were not glamour franchises in the relevant periods. Public money does not pour into OKC and Orlando games the way it floods into Lakers and Celtics matchups. That reduced public attention means the line-setting process is less distorted by sentiment, and the lines are more likely to be set purely on merit — giving an efficient team in an efficient market a fair chance to outperform. The teams with the worst long-term ATS records are almost always the most publicised, most followed, most publicly bet franchises.
The early-season back-to-back data provides one of the most reliable specific ATS patterns: road teams in games 2 through 12 of the season, playing the second game of a back-to-back, went 235-172-5 ATS since 2004, producing a cover rate of 57.7%. A hypothetical £100-per-game bettor on those specific situations would have returned a profit of over £5,000 across the full sample. That pattern — not a team-based ATS record but a situation-based one — is where I look for systematic value rather than team-level historical records.
How to use ATS records correctly: treat them as a reason to look closer rather than a reason to bet. A team with a strong multi-season ATS record earns a spot on your watchlist. Then you examine why the record exists. Is it a consistent pricing inefficiency? Is it a specific situational pattern? Is it variance that is now resolved as the market adjusts? The answer determines whether the edge persists. A record built on a specific coaching system that is now gone is not a predictive tool. A record built on a structural market inefficiency — chronic underpricing of a particular team’s quality — is worth continuing to monitor and potentially exploit while the conditions hold.
Short-term ATS records — fewer than 30 games — contain very little signal. A team going 8-2 ATS over the past ten games might reflect genuine value, or it might reflect the fact that 10-game samples in spread betting have enormous variance. The professional approach is to require a minimum of 50-100 games before treating an ATS trend as actionable, and to ask at each review whether the conditions that produced the record are still present in the current season.
Handicapping Favourites vs Underdogs
There is a version of this question I get more than any other from punters new to spread betting: «Should I be backing big favourites or looking for underdog value?» The honest answer is that the question is almost backwards. The spread theoretically neutralises quality differences, so the real question is never who to back — it is whether the line is priced correctly for the specific situation in front of you.
That said, there are genuine structural tendencies in how the NBA spread market prices favourites versus underdogs, and understanding them is practically useful. The public heavily backs favourites, particularly marquee teams in nationally broadcast games. This creates systematic line inflation on the favourite side. Bookmakers know that a bet on a glamour team at -8 will attract far more action than a bet on the opponent at +8, regardless of the actual probability distribution. They price accordingly — and that pricing makes large favourites slightly less attractive as bets than the raw numbers suggest.
As the editorial team at Pickswise observed when analysing the league, «the NBA is a tough league to bet on with firm favourites but frequent upsets across a long season — any team can beat another on any given night regardless of realistic championship contention.» This is the volatility that makes NBA underdogs interesting. A team getting 10.5 points does not need to win the game — they just need to keep it within single digits, which happens with surprising frequency when scorelines are high and a run of 8-0 can materialise inside two minutes.
My general framework for large spreads — those of 10 points or more — starts with pace analysis. High-pace games produce more variance in final margins. If a heavy favourite plays at a top offensive pace but faces a team that grinds and slows things down, the game structure itself compresses the final margin. A slow-paced underdog is often a better ATS bet than a fast-paced one, because the pace mismatch makes blowout outcomes less likely and covers more probable.
For tight spreads in the 1-4 point range, the calculus shifts. Here the spread is essentially offering you a half-game’s worth of insurance on the perceived underdog. If two teams are genuinely close in quality but the public narrative is running strongly one way — a recent hot streak, a rivalry game, a star’s return from injury — the line often drifts enough to create value on the underdog. I look for situations where the narrative is explaining the line rather than the underlying performance data.
One specific situation worth flagging: teams that received significant public attention earlier in the season but have since declined in performance. The market adjusts slowly to changing realities. A team dominant in October can be mediocre by February, but if public perception still rates them highly, the line stays inflated longer than it should. These lag situations are among the most reliable sources of spread value across a full NBA season.
A concrete way to test whether you are backing a favourite for the right reasons: remove the team names from the situation and replace them with their current statistical rankings. If a team is 12th in net rating, 18th in defensive efficiency, and playing the third game in four nights, the spread probably should not be -8. If it is, the extra points came from narrative — a famous roster, a strong start to the year, a recent win streak. Narrative does not cover spreads. Performance does.
Line Shopping Across UK Bookmakers
Half a point sounds trivial. Over a season, it is the difference between a profitable record and a losing one. I cannot stress this enough: line shopping — comparing spreads across multiple UK bookmakers before placing any bet — is the single highest-yield habit a serious NBA punter can develop. It costs nothing except the five minutes it takes to open a second browser tab.
Here is why it matters in concrete terms. The key numbers in NBA spreads are the whole integers where game scores cluster most frequently — margins of 3, 4, 6, and 7 appear with above-average frequency in final results. If one bookmaker has a spread at -3.5 and another has it at -3, there is a meaningful difference in expected value. A bet at -3 can push on a 3-point game; a bet at -3.5 loses it. Over dozens of bets that land near these key numbers, the difference accumulates into real money.
Among UK bookmakers covering NBA markets, spreads typically vary by 0.5 to 1 full point on any given game — particularly for matches that are not the primary card for that night. Less-publicised games, mid-week regular season contests, early-season matches — these often show wider variation because bookmakers are paying less attention to competitive pricing against each other. These are exactly the games where shopping pays off most reliably.
The practical approach: maintain accounts at a minimum of three UK-licensed bookmakers with strong NBA coverage. Before placing any spread bet, check all of them. The thirty seconds this takes returns more profit over a season than almost any single analytical edge you can develop.
A deeper look at how to systematically exploit line differentials and which key numbers matter most is covered in the line shopping for basketball bets guide, including the mechanics of best odds guarantees as they apply to spread markets.
A word on the odds format while we are here. UK bookmakers quote spreads in decimal odds, which makes calculating potential returns straightforward — multiply your stake by the decimal odds and subtract the original stake to find profit. But the odds themselves carry information. When a spread that was priced at 1.90 on both sides suddenly shows 1.95 on one team and 1.85 on the other, the bookmaker has moved the juice as well as the line — a signal that they are trying to attract action one way without necessarily moving the number. This happens on big games with heavy public action and is worth noting as a secondary data point when you are assessing a market.
Point Spread Betting: Your Questions Answered
What does -6.5 mean on an NBA point spread?
A spread of -6.5 means the favourite must win by 7 or more points for a bet on them to pay out. If you back the underdog at +6.5, they can lose by up to 6 points and you still win. The half-point eliminates any possibility of a push — every bet settles decisively as a win or a loss.
How do I know if a line has been moved by sharp money?
The clearest signal is reverse line movement: when the spread moves in one direction while the majority of public bets are on the other side. If 70% of tickets are on Team A but the line shifts in favour of Team B, that indicates professional money on Team B that the bookmaker has chosen to respect. This is widely considered the most reliable indicator of sharp action available to recreational bettors.
Is ATS record a reliable long-term predictor in the NBA?
ATS records are more useful as a diagnostic than a forecast. A strong multi-season ATS record signals a genuine market inefficiency, but it degrades as bookmakers adjust their pricing over time. Treat historical ATS records as a reason to look closer at a team’s current situation, not as a standalone reason to bet. Short-term ATS streaks of fewer than 30 games contain very little predictive signal.
Can I bet NBA spreads in-play on UK bookmakers?
Yes, most major UK bookmakers with NBA coverage offer live spread markets during games. In-play spread betting requires faster decision-making and a clear understanding of how momentum shifts affect short-term scoring. Bookmakers adjust in-play lines quickly after significant runs, so the window for finding value is narrower than pre-game. It is a viable market for bettors who watch games closely and can act on real-time information rather than delayed data.
Creado por la redacción de «Basketball Betting Strategies».