Home Court Advantage in NBA Betting: What the Numbers Really Mean
Home court advantage is one of the most universally cited factors in basketball betting. Ask any punter why they are backing the home team and «home court» is somewhere in the explanation — probably near the top. The problem is that everyone cites it, which means the bookmaker has already priced it in. The question worth asking is whether the standard market allowance for home court actually reflects what home court advantage is worth in the current NBA.
The answer is that the market consistently overvalues home court for a specific reason: NBA home court advantage has declined materially over the past decade, but the market’s pricing model adjusts slowly. Teams that were winning 60% of home games in the early 2000s are now winning roughly 54% — a statistically meaningful drop. If the bookmaker is pricing home court at the historical rate and reality is delivering at a lower rate, there is a persistent gap between the price of home court and its actual value. That gap is what this article explores.
How Home Court Advantage Has Changed in the Modern NBA
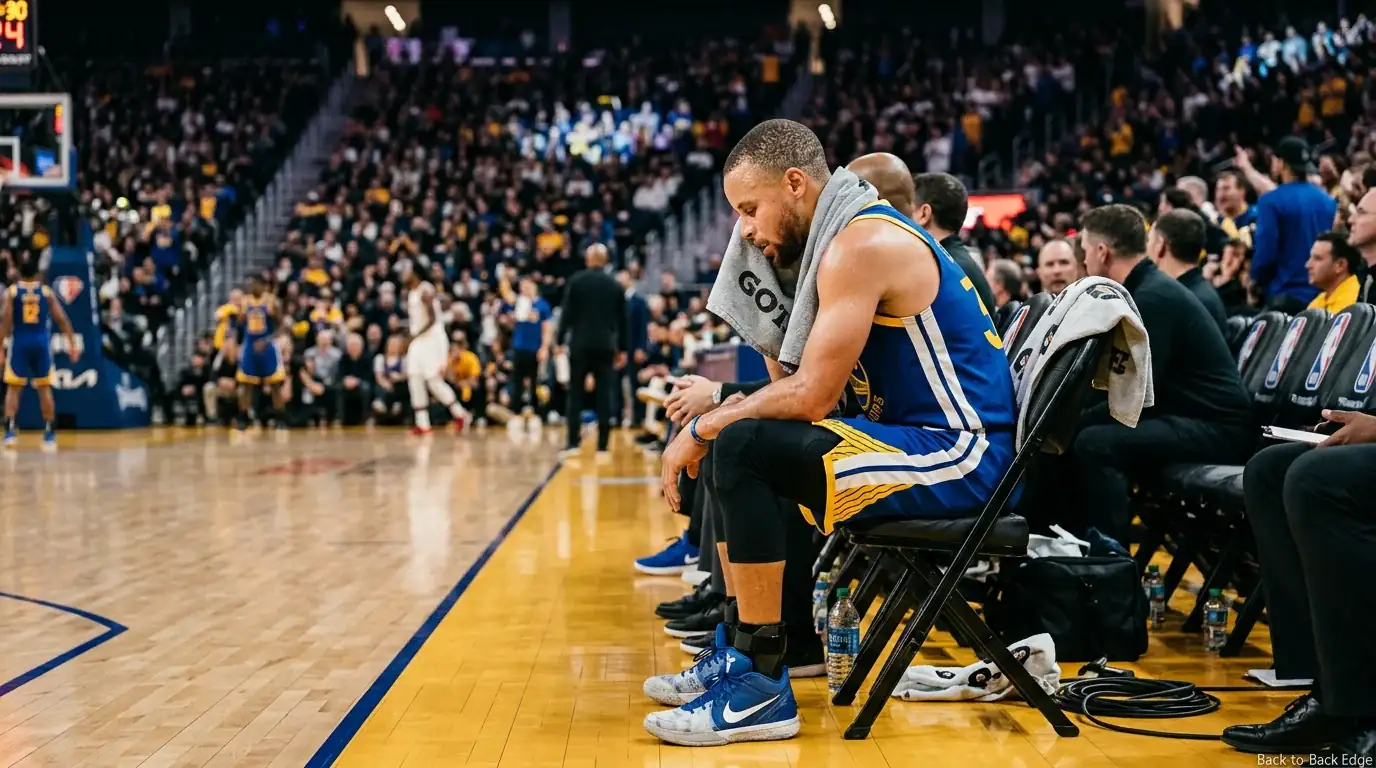
The 2020-21 NBA season — played in bubbles and empty arenas — gave researchers an extraordinary natural experiment. For the first time in league history, a substantial number of games were played without crowd noise, home team introductions, or any of the psychological and logistical advantages that come with playing on familiar ground. The results were striking: home court advantage effectively disappeared. Teams won approximately 50% of home games in bubble conditions, as close to random as you can get in a structured competition.
Home teams in NBA regular season play won approximately 60% of games during the period from 2000 to 2013. That figure has since settled at around 54% and remained there through the 2024-25 season. The decline is partly explained by the elimination of crowd effects during the pandemic seasons and a slow recovery, partly by improvements in travel logistics that reduce road fatigue, and partly by load management practices that have smoothed out the physical toll of the regular season schedule.
Fifty-four percent sounds like a meaningful edge. It is — in outright game terms. But what matters for spread betting is not the win rate; it is whether the market is pricing home court correctly relative to the current 54% baseline. Steve Makinen, writing for VSiN’s NBA analytics desk, identified something important: «There is no way that every team’s advantage is the same. The amount of variance I assign for the 30 NBA teams is as high as 1.2 points, and each point is important.» That variance between teams is precisely what makes blanket home court analysis insufficient. The question is not just «is the home team getting an advantage?» but «how much advantage, for this specific team, in this specific arena, against this specific opponent?»
The historical analysis of home court advantage across 24 NBA seasons confirms the decline in quantitative terms. Early seasons in the dataset showed home teams winning by margins that justified spreads of 3-4 points of home court premium. Current data suggests the real premium is closer to 2-3 points for most teams, with significant variance across individual franchises. A bookmaker applying a uniform 3-point home court adjustment in a world where the average has declined to 2.5 is overpaying for home court on approximately half of all home games — and the public, backing home teams at historical rates, is compounding that error.
One thing worth flagging for UK bettors specifically: NBA home court analysis is predominantly written for North American audiences who are steeped in the historical context. Articles citing «home teams win 60% of games» are often drawing on data from before 2014, which makes the analysis feel authoritative but renders it practically outdated. The most recent Gambling Commission data confirms that the UK NBA betting market is growing rapidly — more bettors are engaging with the sport — but that growth also means more punters are acting on old analytical frameworks. If you are using current-season data to calibrate your models and your competitors are using decade-old assumptions, you already have an informational edge before the analysis even begins.
How Much is Home Court Worth in Spread Points?
The standard industry rule of thumb is that home court is worth approximately 3 points in NBA spread pricing. You will encounter this figure constantly in betting discussions, and it is not wrong as a crude average. The problem is treating it as a uniform value across all 30 teams and all 30 arenas, which the data clearly does not support.
Makinen’s analysis for VSiN showed that the variance in true home court value between NBA teams reaches 1.2 points — the difference between the team with the strongest genuine home court advantage and the team with the weakest. One full point of spread difference is significant in a market where half a point can determine whether a bet wins or loses. Applied to 82 games across the regular season, consistent mispricing of home court value by even 0.7 points in either direction represents a meaningful distortion in the spread market.
Which teams have the strongest genuine home court advantages? The factors that drive real home court value — beyond the crowd noise that all arenas provide — are altitude, arena atmosphere intensity, opponent travel logistics, and the specific style of play the home team uses. Denver’s altitude is the most clearly documented physical factor in the league: visiting teams playing at 5,280 feet genuinely perform below their standard performance levels, and the market has become increasingly aware of this. Games at altitude have seen this advantage partially priced in over the past five years, reducing the remaining edge somewhat. But for teams whose home court advantage is less obviously attributable to a single factor, the market is slower to calibrate.
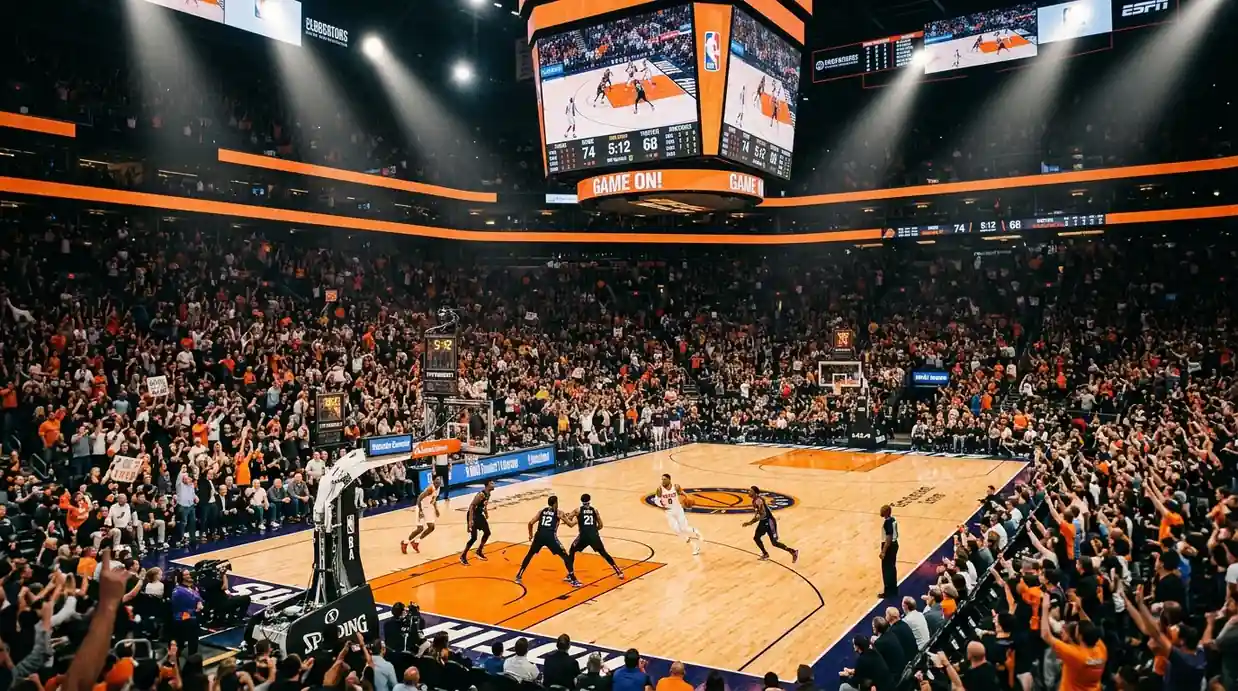
The arena atmosphere factor is harder to quantify but worth acknowledging. Certain arenas generate crowd energy that demonstrably affects officiating and opponent decision-making. Others are known as «quiet» arenas where visiting teams report feeling comfortable. These reputations are real and they influence actual game outcomes — but whether bookmakers accurately capture them in their spread pricing is less clear. My working approach is to treat explicit, documented factors (altitude, travel distance for road opponents) as reliably priced, and to treat atmosphere-driven factors as opportunities for observation without systematic betting until I have enough data to form a confident view.
The practical implication of all this variance is that home court should be team-specific in your analysis rather than a flat adjustment. Before applying any home court premium to a game, ask: what is the specific evidence that this team has a stronger-than-average home court advantage? Is it altitude? A specific arena factor? Recent ATS record at home versus on the road? If the answer is «teams generally do better at home,» that is not sufficient evidence to pay a premium above the standard market rate. If the answer is «this specific team has covered the spread in 11 of their last 14 home games while covering just 6 of 14 on the road,» that is a meaningful data point worth building on.
When Overconfident Public Money Meets Home Court Pricing
The structural mispricing of home court advantage is most visible in one specific situation: when a home team receives heavy public betting action on top of an already-generous home court premium. The back-to-back data illustrates this precisely. When a home team playing the second game of a back-to-back receives 65% or more of public bets, they cover the spread just 42% of the time. The public is backing home court while ignoring fatigue. The bookmaker has set the line to attract that public action. And the result is a spread that significantly overvalues the home advantage in a specific game context.
This is not limited to back-to-back situations. Any time the public sentiment around a home team runs strongly ahead of what the actual performance data supports, home court becomes a premium they are paying for twice: once in the spread (which the bookmaker has set aggressively to reflect the expected public action) and once in their confidence (which is not a bet outcome, just a feeling). The practical result is a systematic tendency to overbid home favourites.
The ATS records of certain teams confirm this. OKC Thunder’s 69-39 ATS record over roughly two and a half seasons (a 64% cover rate) — the best in the league for that period — came from a team that was chronically underestimated by the public rather than overestimated. Orlando Magic’s 65-42 record (61%) fits the same pattern: a team that did not attract outsized public attention but consistently outperformed the spread because the market underpriced their actual quality. Neither team was playing primarily on the back of home court pricing — they were exploiting a broader market inefficiency — but the principle holds. The teams that cover spreads most consistently are the ones the public underestimates, not the ones they love.
Practically, the filter I apply for home court situations is straightforward: when a home team’s spread has moved more than 1.5 points from the opener in their favour and public betting percentages are above 60%, the road team is worth examining seriously. The line has been driven by sentiment rather than information, and sentiment-driven lines are the most reliably exploitable market condition in NBA betting.
I want to add one more dimension to this: the timing of public money in home court situations. The public’s attachment to home teams is not uniform throughout the betting window. It tends to be strongest in the first hours after a line is posted, when casual bettors act on the simple heuristic of «home team good.» Professional bettors, who tend to act closer to tip-off when more information is available, often push lines back toward fair value in the final hours. This means that if you are observing a home team spread that has moved significantly from the opener due to public money, and then watching it drift back slightly in the hours before the game, the line is showing you exactly the tension between public sentiment and sharp opinion. A line that held at the inflated number despite late sharp action is more concerning than one that drifted back slightly — the latter suggests the market self-corrected.
Accounting for Opponent Travel in Your Analysis
Home court advantage is partly about the home team’s comfort and partly about the road team’s disadvantage. These are related but not identical factors, and treating them as one thing produces imprecise analysis. A team playing at home against an opponent on the second game of a back-to-back that involved cross-country travel is in a different situation from a team playing at home against a rested opponent from a nearby city — even if the spread treats both situations the same way.
Time zone crossings are the most documentable form of travel-related disadvantage. A West Coast team flying to New York for an East Coast game faces a 3-hour time zone change that affects sleep schedules, recovery, and pre-game preparation. The inverse — East Coast teams flying to the Pacific — is generally considered slightly less disruptive because it adds hours to the day rather than removing them, though both create genuine performance effects. Teams on extended road trips — five games or more without returning home — also accumulate cumulative travel fatigue that can persist even when individual games are not back-to-backs.
The challenge is that much of this road fatigue information is already incorporated into spreads through market efficiency. Bookmakers model travel factors in their power ratings. What they may miss are the interaction effects: a team on a long road trip that is also playing back-to-backs is in a significantly worse situation than either factor alone suggests. It is the compounding of travel fatigue and scheduling fatigue that the market occasionally underweights, particularly in complex schedule clusters that occur 3-4 times per season for most teams.
My approach to opponent travel analysis: I note travel patterns but do not apply a fixed spread adjustment. Instead, I use it as a confirming factor when other indicators are already pointing in the same direction. A road team with travel disadvantage plus back-to-back status plus a mismatch in rest days versus the home team is a situation where multiple factors stack. One factor alone is priced in; the combination may not be.
The specific matchup where travel analysis most reliably produces value is the West Coast team playing an East Coast back-to-back: flying from Los Angeles or Phoenix to New York or Boston, playing one game, then moving on to another East Coast city the next night. These trips exist on the schedule several times per season and represent genuine physical disadvantage that compounds across both games. The home teams in the second game of those trips benefit from opponents who are not just fatigued from one game but from multiple nights of disrupted sleep and cross-continental travel. Bookmakers model this, but not always accurately enough — particularly when the narrative of the first game (a big win, a big loss, a star player’s strong performance) dominates public attention and creates crowd betting on the subsequent game that pushes the line away from the more analytically grounded position.
Building a Home Court Filter for UK Bettors
The practical question that follows all of this analysis is how to translate it into a betting decision process. The theory about home court declining, public money overpricing favourites, and travel factors compounding is only useful if it produces a clear action framework.
The filter I use has three primary conditions. First: is there a specific, documentable reason why this home court advantage is greater or less than the standard market allowance? Altitude counts. Verified arena intensity (certain franchises with well-documented crowd effects on officials) counts. General «they like playing at home» sentiment does not count unless it is supported by recent performance data. Second: is the public betting percentage driving the line in one direction without a corresponding move in sharp money? Reverse line movement is the tell — line moves toward the road team while public tickets back the home team signals professional money on the road side. Third: is there a stacking factor (back-to-back, travel, extended road trip for the opponent) that compounds the home court pricing error?
When all three conditions align — a questionable or inflated home court premium, public money absent sharp confirmation, and a stacking situational disadvantage for the home team — that is when I treat the road team as a genuine cover candidate. When only one or two conditions align, the situation stays on my observation list rather than moving to a betting decision.
The discipline of this filter is in the «no» decisions. Home court is a real factor and backing road teams as a systematic strategy is not a long-term winner. The filter exists to identify the specific subset of games where home court is being priced above its actual current value — not to replace the underlying fact that home teams win more often than road teams and that the market prices this correctly on most occasions.
Over a typical NBA regular season, I identify perhaps 20-30 home court situations that pass all three conditions. I do not bet all of them — additional game-level analysis sometimes reveals that even a mispriced home court premium is not sufficient to overcome a fundamental talent mismatch. But having the filter means I never back a home team or oppose a road team purely out of instinct. Every home court decision goes through the three-condition check, and the majority are rejected at one of the three stages. That discipline — the willingness to not act — is more valuable than the situations where I do bet.
For how public betting data intersects with sentiment-driven pricing in the broader market context, the NBA public betting trends guide covers the mechanics of how public percentages move lines and when fading the crowd creates genuine long-term value.
Home Court Advantage: Your Questions Answered
How much is home court advantage worth in NBA betting odds?
The industry standard is approximately 3 points of spread value, but this overstates current reality for most teams. Home teams now win roughly 54% of regular season games — down from 60% in the 2000-2013 period. The genuine spread value of home court varies by team and arena, from below 2 points for teams with weak home effects to above 3.5 points for teams with documented structural advantages like altitude. The flat 3-point rule is a starting point, not a settled fact.
Has Covid changed how much home court matters in the NBA?
Yes. The pandemic seasons played in bubble environments demonstrated that home court advantage effectively disappears when crowds are removed. Since the return to normal conditions, home court has recovered but not to its pre-pandemic level — settling at approximately 54% rather than the 60% seen in the early 2000s. Whether this represents a permanent structural shift or a slow recovery trend that will return to historical norms is not yet clear, but the current data strongly suggests the old 60% figure should not inform your spread analysis.
Which NBA arenas genuinely affect game outcomes?
Denver’s altitude at the Ball Arena is the most clearly documented arena-specific advantage in the league and has been confirmed by multiple independent analyses. Beyond altitude, the arenas where crowd intensity is most consistently cited as affecting officiating and opponent decision-making are harder to quantify. Home court advantage varies by as much as 1.2 spread points between the strongest and weakest franchises, meaning the answer is genuinely team-specific rather than universal.
Should I always favour the home team when betting NBA spreads?
No. The spread is designed to neutralise the quality difference between teams, including home court advantage. Systematically backing home teams at the spread covers roughly 50% of the time — by design. The insight from home court analysis is not to back home teams broadly but to identify specific situations where the market has overpriced home court (heavy public action, declining team form, stacking road disadvantage for the opponent) and bet accordingly in those targeted situations.
Preparado por la redacción de «Basketball Betting Strategies».